When it comes to socioeconomic status, the difference between economically disadvantaged and not economically disadvantaged groups (as far as net gain or loss in test scores during the pandemic) was much less pronounced than we had originally thought would be. If we take a look at the graph, we can see that very plainly those who are in the higher socioeconomic status bracket tend to do significantly better than their lower socioeconomic peers. This is the case in both math and ELA test scores. However, a similar declining pattern can be seen in both groups for both subjects following 2020. In fact, the patterns for each subject are remarkably similar, showing that each socioeconomic group took very similar hits in both subjects and had roughly the same amount of struggle during the pandemic.
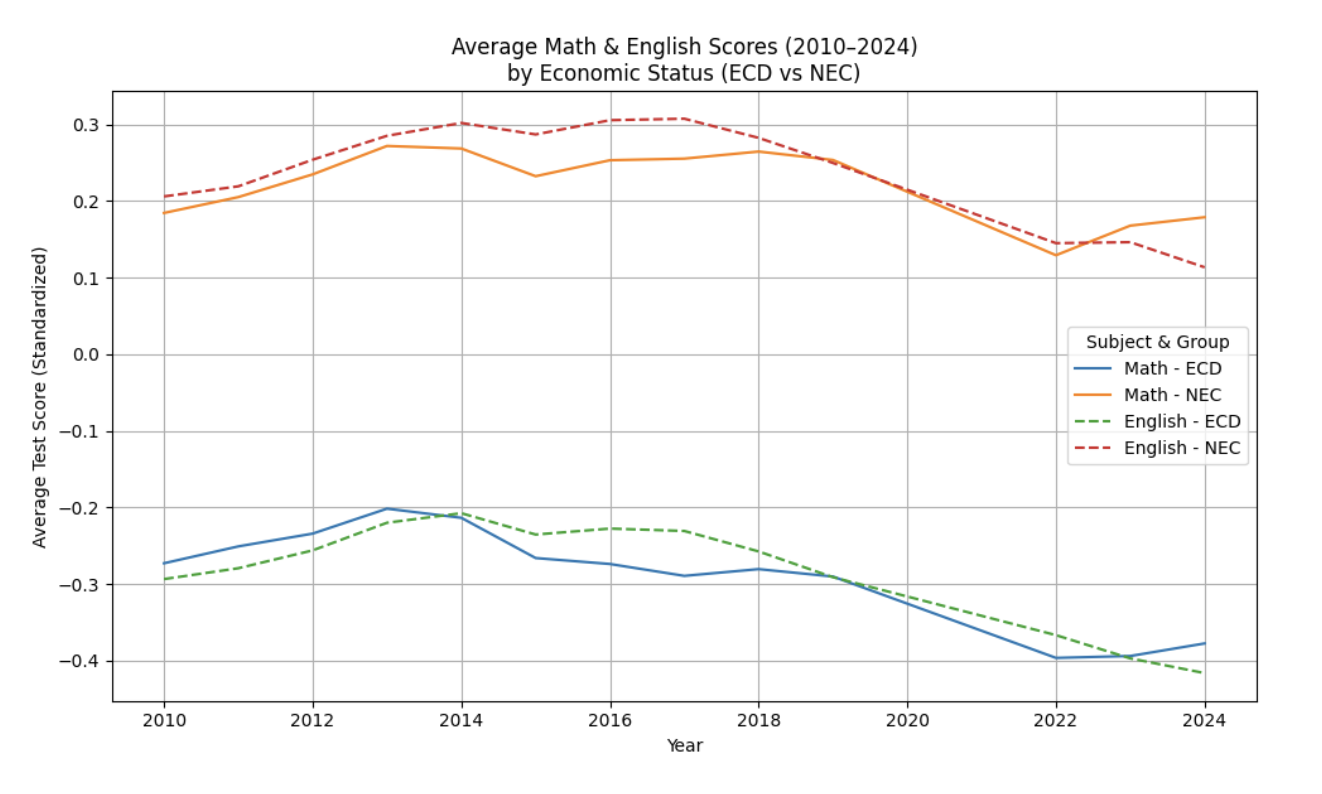
Figure 5. Line chart indicating average test score over time grouped by (Economically Disadvantaged) and NEC (Not Economically Challenged).
This is a rather surprising finding given that, according to Zuniga-Montanez et al., students that were in a socioeconomic class tended to do poorer in virtual-learning settings than those of a higher socioeconomic class (Zuniga-Montanez et al.). In particular, she focuses on language development, a critical skill learned by younger students in the public school system. In her overview using 94 different studies conducted during the pandemic, she found that students who were in a lower socioeconomic subclass struggled more in language development than their upper-class peers. This is likely due to the home environment differences present for each socioeconomic class. In Zuniga Montanez’s study, she found that homes that either had more access to technology and/or had parents at home helping the children study were more likely to succeed in language learning and development (Zuniga-Montanez et al.). Since many poorer families were forced out of the home in order to have a job during the pandemic, many children did not interact with their families, nor did they have the very expensive technological means to study.
Because our graph does not exactly align with this study and other existing literature, we speculate that previous findings might be more racially than socioeconomically tied, meaning that much of the adversity and difference in struggle were likely not caused mostly by class differences. Instead, a more thorough and telling story may be through exploring racial differences among the students and how race/ethnicity affected one’s test scores.