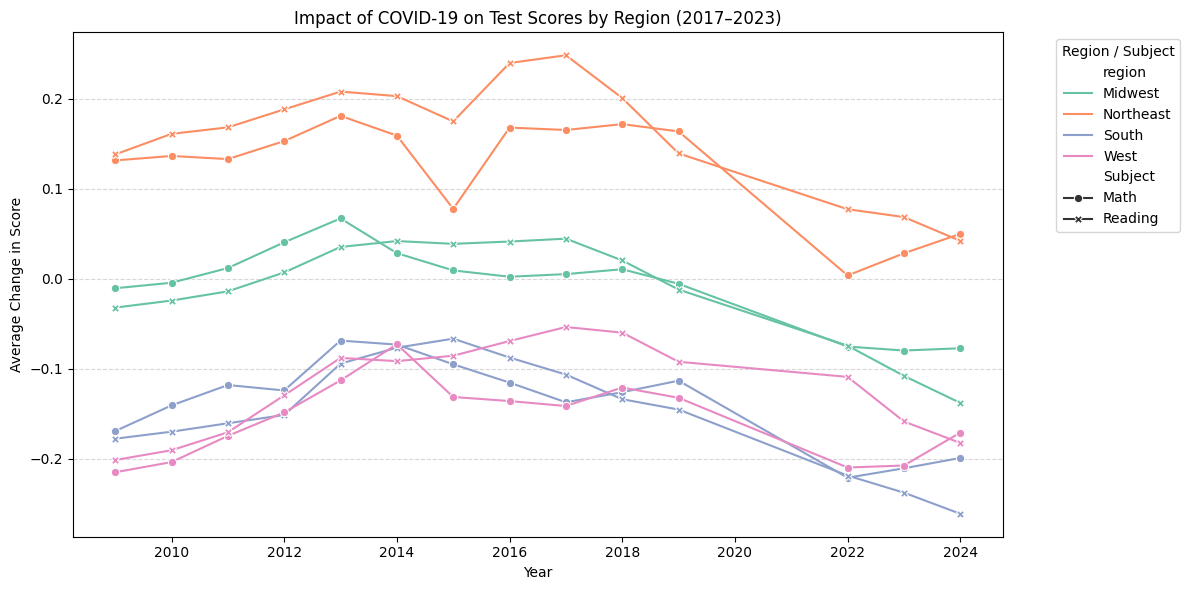
Figure 6. Line charts indicating the change in score (between pre and post-COVID) by US Region (Midwest, Southeast, South, West)
The West is defined as the states of Alaska, Arizona, California, Colorado, Hawaii, Idaho, Montana, Nevada, New Mexico, Oregon, Utah, Washington, and Wyoming.
The South is defined as the states of Alabama, Arkansas, Delaware, Florida, Georgia, Kentucky, Louisiana, Maryland, Mississippi, North Carolina, Oklahoma, South Carolina, Tennessee, Texas, Virginia, and West Virginia.
The Midwest is defined as the states of Illinois, Indiana, Iowa, Kansas, Michigan, Minnesota, Missouri, Nebraska, North Dakota, Ohio, South Dakota, and Wisconsin.
The Northeast is defined as the states of Connecticut, Maine, Massachusetts, New Hampshire, New Jersey, New York, Pennsylvania, Rhode Island, and Vermont.

Figure 7. Map of change in math scores for each US state (where data applicable).
Since our data was separated into each school’s respective state, we found it pertinent to categorize our data into larger regions of the U.S., namely the west, the midwest, the south, and the northeast, respectively (See note at end of section). What can immediately be seen in our data visualization is that each region has a similar rise and decline in their own math and ELA scores. Additionally, what can also be seen is that, following 2018, there was a significant drop in scores for all regions in both categories, with some regions being hit harder in one subject versus another (e.g the northeast was hit much harder in math). There can also be seen a small rise in scores around 2024. However, while each region followed a similar pattern of decline and rise, they are all located on significantly different sections of the graph. For one, it is clear to see that each region of the U.S. tends to follow a particular order from lowest to highest test scores; west and south with the lowest, followed by midwest, and finally the northeast with the highest scores. These stayed mostly the same following the COVID-19 pandemic with the only difference being that the west is now more firmly higher than the south.
While the decline in test scores is not necessarily an unforeseen outcome, the region in which a student lived was often a great indicator of how much COVID-19 schooling affected them. In fact, Halloran et al. goes as far as to say that the largest predictor of a student’s test score recovery was the state that they live in (Halloran et al.). While their study admits that there is no exact clear reason why this is the case, we can likely attribute it to the difference in policies that vary by state as well as the level of funding provided for public education. Some states were more adamant about going back to in-person schooling while others remained online. Additionally, there were some states that were only able to provide the bare minimum for their students while some other states were able to provide technology, wifi, and tutoring for their school districts.